Saturday, October 29, 2016

Cubic Exploration


Exploration: Understand the effects of the coefficients of a cubic function in order to sketch them more accurately.


Definition:
A cubic function is defined as a function whose highest x power is 3, generally in the form of y=ax3+bx2+cx+d. The parent function is simply y=x3. The image to the right shows what the parent function looks like for -2 ≤ ≤ 2.

Parameters a and d:

For any function, the constant term (d) is a translation upwards or downwards, depending on the value of that constant. This graph should be no exception. Should this graph only consist of y=x3+d, the zero will be at the cube root of -d, with a multiplicity of 3. Next, I'm going to take a look at the a coefficient, since that's attributed with the x3.

Desmos has a great addition, where you can create a coefficient, and animate it. This makes it so we can see the effects in real-time. The video to the right uses this animation tool to show the effect of changing a when every other value is 0. The only thing really affected is the vertical stretch of this graph, as well as the reflection across the x-axis. [Note, if there is a video, I highly recommend you open the link to see the video on a larger portion of your window.]

Parameter b:

A cubic doesn't just have an x raised to the third power. A cubic also holds an x raised to the second power, and a linear term. With this logic, we can potentially apply that to how they affect a cubic function.

By changing the quadratic coefficient (b) of this cubic function, it creates "bumps" in the graph. We can see this as the blue function (cubic) compared to only the purple function (quadratic). Although the values aren't perfectly lined up, they're fairly close.

Stationary Point (1):

There seems to be a pattern, however, between the stationary points and the values of b and a. In a quadratic, we called this the Axis of Symmetry, and that would give us the x value of the vertex. It was found by the following equation: x=-b/(2a). Or using the terms we defined here, x=-c/(2b). I believe the x value of the vertex would be found in a similar way. Assuming this is going to be the product of a negative with a fraction, the best point to test is when the values are the smallest integer possible. In this case, I'm trying to create a stationary point in the first or fourth quadrants of the graph. By setting a=1 and b=-1, I have created a stationary point at (0.667, -0.148). This is great, because it already shows me what the relationship is. According to what I found, when c=0, it is safe to assume the stationary point will be at -(2b)/(3a).

Parameter c:

Next, we have the c parameter to look at. Looking at the graph of y=x3+cx, the first thing I noticed is the fact the graph becomes more wavy when c < 0, and it becomes more linear as c > 0. However, this pattern is reversed if a becomes negative.

At this point, I'm going to do the same thing to this parameter as I did for the b parameter, which is comparing this graph to the linear graph of y=cx. The video includes every parameter, however, in order to see if c depends on other variables.
It is evidenced that the parameter c is the tangent of the y intercept.

Stationary Point (2):
Through watching each parameter working together, my initial reaction to the stationary point is actually off. The d parameter has no effect on the stationary points. However, the parameter c has some small effect. The stationary point does not exist when c and a have the same signs, though the stationary point seems to change as c changes as well. I have set a=1 and b=-1 again in order to find the stationary point again, and have manipulated c in order to reach an integer value for the x-coordinate of the point. In this case, setting c=-1 gives me an x coordinate of 1. Setting c=-8 also gives me an x coordinate of 2.

-{So I did a bit of research because nothing seems to be working, and I need Calculus to do this.}-

The tangent of the stationary points, by definition, is 0. What I need to do is take the derivative of the equation y=x3-x2-4x-5 and find the point where slope is 0.

A quick explanation of derivatives:
y=axn    (Original)
y'=anxn-1     (First Derivative)

Although I don't quite understand why, this is the gist of what you need to know for this.

So the derivative of x3-x2-4x-5 is 3x2-2x-4.

Now, we solve 3x2-2x-4 for 0. This gives us the x coordinate of our stationary points, where the slope is 0. Then we plug that value in for x in our our original equation, and we get the y values of those stationary points. The fact our parameter d doesn't change the x values of the stationary point makes sense, as the derivative of a constant is 0. (Therefore, the anti-derivative of 3x2-2x-4 is x3-x2-4x+C, where C is literally constant.)

Zeros of Cubics:
The zeros of a cubic are actually pretty simple to find. As long as we have the equation of the line, we can use the Factor Theorem, which states a polynomial has a factor of x-a if P(a)=0. We can also use the Rational Roots Theorem, which states every rational zero of the polynomial can be written as p/q, where p is the factor of the constant term, and q is the leading coefficient. Alternatively, we can use Synthetic Division to test/find factors. This is described below. The diagram below was found on mathbitsnotebook.com .

synpicN

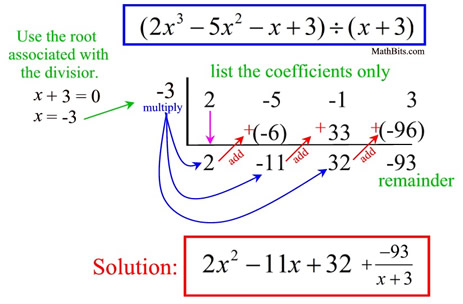
Since this can just be done in a "guess-and-check" technique, one might as well just plug in a value into the function to find a 0.

Point of Inflection:

To find the point of Inflection, we need to find the first derivative. The graph x3-x2-4x-5 has the derivative 3x2-2x-4 . The point of inflection is found at the vertex of the derivative - Or at least the x value is. Once you have the x value, plug that into the cubic and solve. In this case, the vertex of the quadratic is (0.333, -4.333). Plugging 0.333 in for the original equation, we get the point of inflection to be at (0.333, 3.593).

Conclusion:

To conclude, all the parameters in y=ax3+bx2+cx+d work together to create all sorts of graphs, using different patterns such as the tangent lines. Creating a graph from an equation is simple, as long as we use those patterns. Using everything we learned about before, we can find the equation from the graph, as long as we're given the points. All we have to do is the opposite of what this exploration has shown.

Tuesday, May 3, 2016

Factorial

Question: What happens when we take a factorial of a negative number? How about a fraction/decimal? Why does it show up with the answer it gives?


Overview: We all know that the factorial of a natural number is just taking that number and multiplying it by every natural number down to one. 1! = 1, 2! = 2, 3! = 6, 4! = 24, 5! = 120, 6! = 720, (...) The issue is broken when we go back from Natural numbers to whole numbers. When we reach 0, the factorial doesn't go down from 1 to 0, it stays at 1. So what happens at a decimal?

The first thing I'm going to discuss is the fact that 0! = 1. At first, it's a bit strange, seeing as it should technically be 0. (Anything multiplied by 0 = 0.) But what we can do is look at it from a descending perspective. The current task is to get from the first factorial below to the second.


This should be simple, as n! = n * (n-1) * (n-2) ... , and (n-1)! = (n-1) * (n-2) * (n-3) ... . Simply enough, we can just divide off n and reach (n-1)! .


By following that logic, we can deduct the following image to contain true information. Because the logic can keep going, this clearly evaluates to 0! = 1. However, there's a certain flaw to this idea, which will be discussed below.

Negatives:
Assuming this statement is correct, this makes a small break when it comes to negatives. Nothing can be divided by 0. So when asked (-1)! , math gets broken. We would need 0!/0 , or 1/0. Undefined. This is why there are no integers below 0 with factorials. Going down to -2 would lead to undefined/-1. There's no such thing. Now, let's go into the odd section: Decimals and Fractions.


Fractions and Decimals:


Welcome to the world of "What the heck is going on?" This is the graph of x! where 10 ≤ x ≤ 3.2 . At least we can make some sense out of this graph so far. We have the whole numbers giving anything we would normally expect. 0! = 1 , and the numbers begin to exponentially grow. All the negative integers go to "undefined" (though unclear on the graph).

For the decimals, I decided to try looking at 0.5! , which is 0.886226925453.

My initial reaction was that it could be the result of a denominator and a numerator that were each factorials. But plugging it into the calculator yielded no fractions with that value. There goes that idea... The only fraction I can think of would be 886226925453/1000000000000.

My next reaction was to take the square root of some imperfect square. But the imperfect square would have to be less than 0.5, so how my next question is: What do we do from here? I'd rather not take the square root of a fraction, which will probably hurt me in the later-run of this exploration... So instead, I multiplied 0.5! by 2. This brings me up to 1.772453851. Alright, so now I feel like I'm getting places. I know this is the square root of a number less than 4, since that would be 2. If the square root was 2, I would be at 1.4... , and sqrt(3) = 1.73. I'm close, but just a bit below. But I don't see a reason for it to be a decimal, unless it was even at 3.5. So what's my next move? I've decided to try to square that value to see what I get. And it gives me... π? It is, unless somewhere down the line it changes away. It seems like 0.5! = sqrt(π)/2 . Well alright then. But it doesn't quite answer what happens for other things, and why does sqrt(π) work?

At this point, I think I've tried a large group of numbers, and a large number of equations to try and help myself solve this. I can't come up with a good relationship between a decimal and the square root of π in order to make a proper rule. And it doesn't exactly help that my calculator doesn't know how to do these factorials.

Edit: I've experimented with everything, even going into integrals (yes, I learned that on my own time), and I still can't find anything useful. I'm gonna Google it and write the results below.

So I found something called the Gamma Function. From what I understand, the Gamma Function is literally the Factorial Function, with the only add-on being shown like this: Γ(x) = (x-1)! . The gamma function, however, is the image below:


Let me explain what's going on in this as simply as possible. Γ(t) is just the way we name this function, similar to how we generally use f(x). But since this is a special (and a very advanced) function, we have a special name for it. After the equals sign, we have the "Integral." This basically takes the next part of the equation and finds the area formed by it from the lower bound (0) to the upper bound (infinity). The area is determined by the distance between the x axis and the function, enclosed by the integral symbol and "dx". The "dx" at the end just tells the integral "with respect to x," basically telling it to find the integral of anything between these 2 pieces of the function. The result is the factorial of the previous number. The below video is a quick simulation I made to simulate the integral of the above graph. The z in the function is essentially the constant, which is 1 higher than the constant you wish to factorial. I animated it on Desmos.


Apparently this only works for positive numbers, and there's an Alternate Gamma Function for negatives.

Sunday, May 1, 2016

Subway Sandwiches

Exploration:
Question: How many different combinations are there for sandwiches in Subway?

Background: In Math, we recently learned (or have been reminded of) a simple way to count the different outcomes, and Subway is infamous for the wide variety of sandwiches it can make, especially with the "Make Your Own Meal." This is where you choose the type and size of bread, the sandwich you want, topics, sauces, sides, beverages, and other things. For the following exploration, I will be using the menu below, which comes from this website.

Subway, Weston/Southwest Ranches Menu
*Note: Since my blog broke, the website has changed. This is a relatively old version of the menu. Some of my math will not match this version of the menu.

Several things to note beforehand:
  1. You have the choice at Subway to either toast or not toast the bread.
  2. You don't need to have everything. You can have no extra sauce or toppings if you want.
  3. I will assume you are here for a sandwich, maybe wanting a salad or side orders. You are thirsty in this scenario.
  4. You can have up to 4 vegetables per foot-long sandwich, 2 per 6-inch.
    1. I will assume you have at least 1 topping.
    2. The order you order these in will matter. Lettuce then tomato will be considered different from the other way around.
    3. You can have 1 sauce only, assuming you choose to.
  5. You can have repeats of the vegetables, so 2 tomatoes and 2 lettuce are options.
  6. All my information either comes directly from the Subway Website, or from past experience.
Process (All values are in bold):
The first thing we need to determine is: What kind of sandwich do we want? There are 16 types of sandwiches, as shown in the center of the image. After that, we determine the size. We can have either 6-inch or foot-long. This brings us to a total of 32 possibilities. Next, we can bring in the type of bread. There are 6 types of bread, and they can be toasted or not toasted. This brings us to 384 (32*12) possibilities so far. Now, we can have up to 4 toppings. Having at least 1, we'll set this to 8*9*9*9, so that you have at least 1 topping, and say no to the other 3. It's a bit strange, the way I'm doing it, as you can say no to a second, and end up with a 3rd and 4th, but this is the way I'm sticking with. Just for simplicity. Now, we're up to 2,239,488 possibilities already. Finally, we add a sauce. You can say no. According to the above image, there are 8 sauces, with a 9th being "none." With this, we are now up to 20,155,392 possibilities. How about an extra in the sandwich? The bottom left shows extra items you can add into the sandwich: Extra cheese, beef strips, double meat, or extra pepperoni. Because each of these are different options, we now multiply our previous number by 16, as it's "cheese or no cheese, meet or no meet, (...) ". We now have 322,486,272 possibilities. We can't forget about the salad you may or may not want. Multiply by 5 to get one of these or none: 1,612,431,360 possibilities. There are also 5 side orders you can choose to get, a 6th would be none, and I'm assuming you can only get one: 9,674,588,160. Last but not least, you're gonna need a drink to quench the thirst of all those different combinations: Multiply by 3, since we're assuming you have to get a drink. 29,023,764,480. This is the number of possibilities you can get in terms of sandwiches.

That would be annoying to make a tree diagram for... So many branches that keep going until you get to over 29 billion outcomes...

This large number means you would be able to go to Subway for over 29 billion days and get something different every day. This would be equivalent to 79,517,162.959 years.

My math may or may not be wrong, I would just like to point that out.